Businesses have been working to become more data-driven for years now, with mixed results. According to Harvard Business Review, only 26% of organizations report successfully making the leap. And while there are many reasons why, we believe the problem stems from flawed approaches to creating and sharing trusted data and insights across the enterprise. Go-to-market teams are no exception.
Most revenue organizations are following one of two playbooks when it comes to reporting:
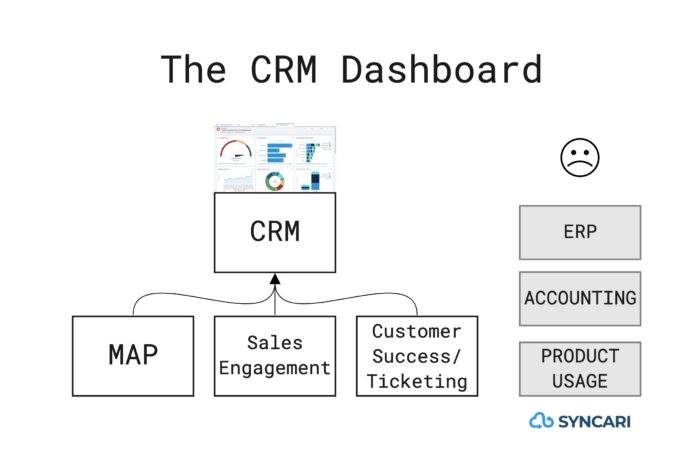
1. The CRM Dashboard
CRM-centric reporting is a favorite among growing teams. It seems simplest and least expensive: stuff Salesforce or Hubspot full of data and then make custom dashboards. But common roadblocks like cross-object limitations, field limitations, lack of revenue or product usage data make it impossible for this view to be truly comprehensive.
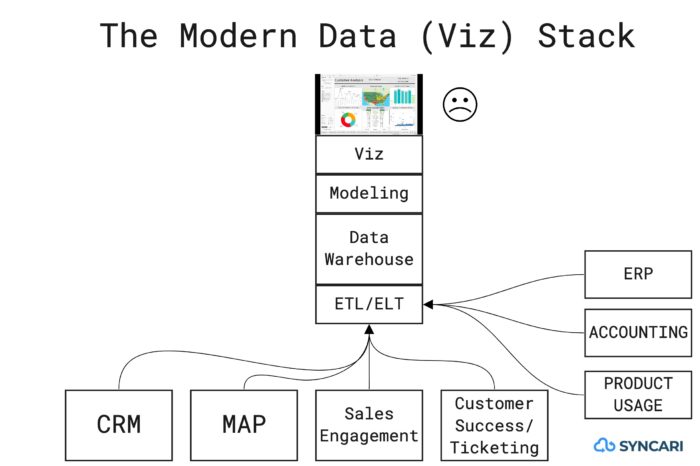
2. The Modern Data (Visualization) Stack
Data science and analytics teams often exist to support go-to-market teams, especially in fast-growing companies. The hidden problem here is how expensive this approach becomes as the stack expands, starting with data warehousing, ELT, reverse ETL and modeling tools, and then adding one or more visualization tools. These data teams often rely on marketing ops, sales ops and revenue ops to provide them with clean, accurate data out of each system. The result is a weeks-old, painstakingly produced set of dashboards, much more expensive than the value they provide.
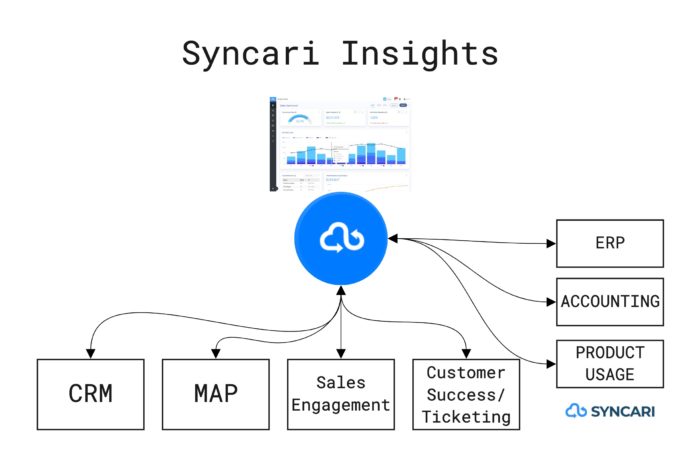
Finally, RevOps-centric reporting with Syncari Insights
Today, we are introducing the preview release for Syncari Insights. Syncari Insights delivers no-code, multi-system analytics and full funnel visibility into business health and GTM performance. Unlike other revenue intelligence solutions, Syncari Insights doesn’t require costly investments in data extraction, transformation, storage and prep. Those are native capabilities of Syncari’s complete data automation platform, helping businesses become data-driven with unprecedented speed and efficiency.
The first set of capabilities covers flexible data set queries that span entities, powerful visualization cards that bring this data to life, and dashboards that arrange the data cards into a full reporting package. This is just the beginning of our vision to improve the entire revenue model from leads to billings. Syncari is extensible to any of your systems and to any REST API.
Key features include:
- Unified data and shared metrics: Automatically align cross-system data to a unified model and calculate metrics using shared logic, ensuring reports are complete and trusted.
- Pre-built data cards and dashboards: Visualize the data from your unified data model using common visualizations like line, bar, stacked bar, column, stacked column, line, table, and metric. You can arrange these cards into dashboards that can be viewed on mobile devices or a desktop browser.
- Cross-object reporting: Syncari Insights handles a known limitation of CRM-centric reporting by producing cross-object reporting with no-code cross-entity queries. These reports deliver actionable unified records from all of your systems with zero code. You’ll be able to use SQL to define these data cards in an upcoming release.
- Insight sync: Calculations, KPIs and revenue signals can be shared with GTM team members, ensuring insights can be acted on in near-real-time.
At its core, Syncari Insights fulfills the mission of driving operational excellence into every part of your GTM business, while staying aligned with the strategy, goals, and heartbeat of the business. We want to enable any RevOps professional to ask and answer questions, gaining operational knowledge and improving instead of waiting on data teams to make only some of that information available while competing against other items in the backlog.
The first release of Insights is the beginning of our journey. We’ve identified many other things about cross-system reporting that are hard. We want to make things like week-over-week reporting, planning for the future, and adding observations to your data easy to accomplish.