Reporting & Analytics
Measure and optimize across the entire customer lifecycle
Tap into your unified data for reporting and analytics and optimize performance across the entire customer lifecycle.
Reporting & Analytics
Tap into your unified data for reporting and analytics and optimize performance across the entire customer lifecycle.
![]()
“With Syncari, I know our data is accurate. This also means the business decisions we make have a greater impact on Chargebee’s success.”
REPORTING & ANALYTICS
Skip the costly investments in data extraction, transformation, storage and prep and explore, interact with and visualize multi-system data directly in Syncari, or visualize it from your favorite BI tool. Effortlessly build complex joins, correlate cross-departmental data, and gain a near-real-time view into business performance.
REPORT
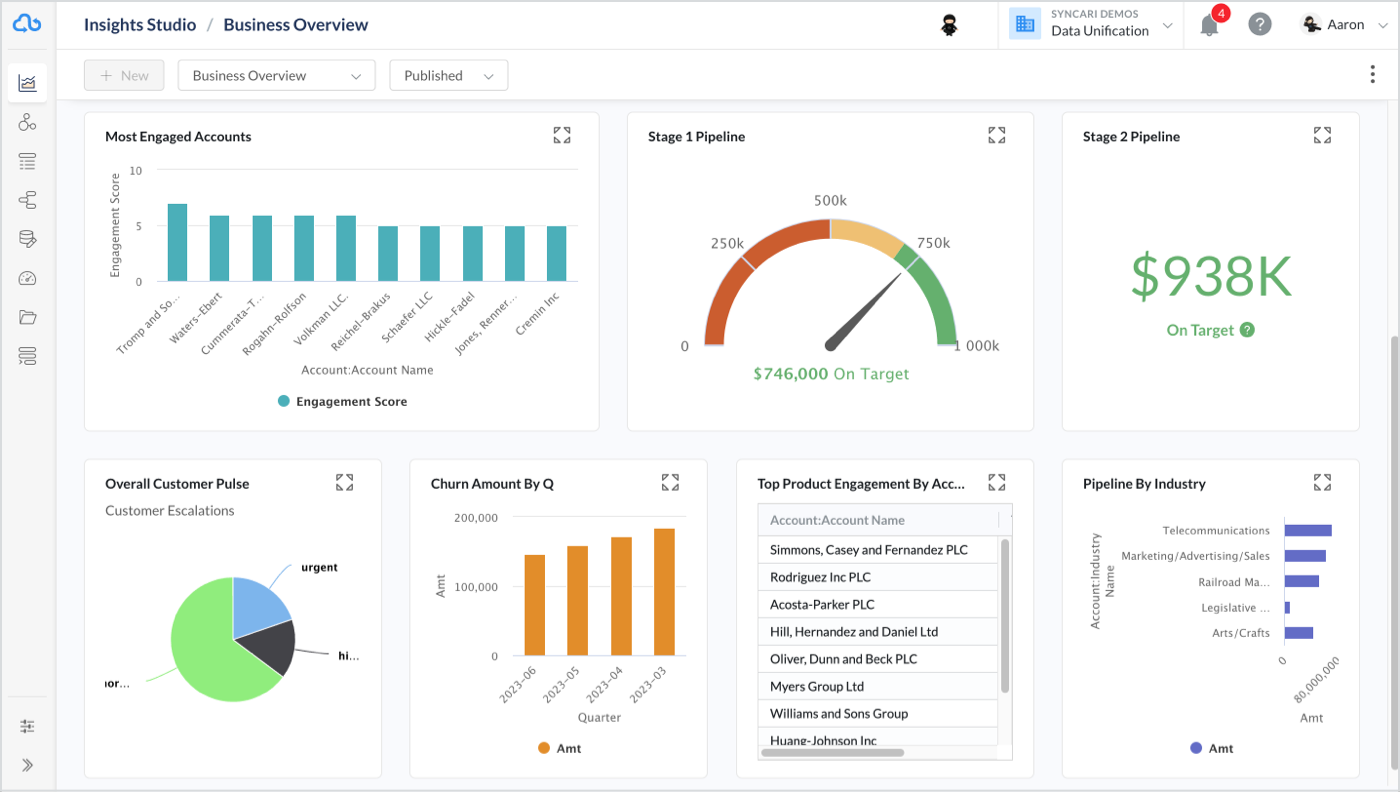
Visualize pre- and post-sales data together from your entire GTM and product stack. Create a shared metrics library, sync reporting tools, and align systems and teams with a shared view of business performance.
VISUALIZE
Access instant insights and real-time dashboards to support data-driven decisions spanning all aspects of the customer lifecycle and revenue generation.
SHARE
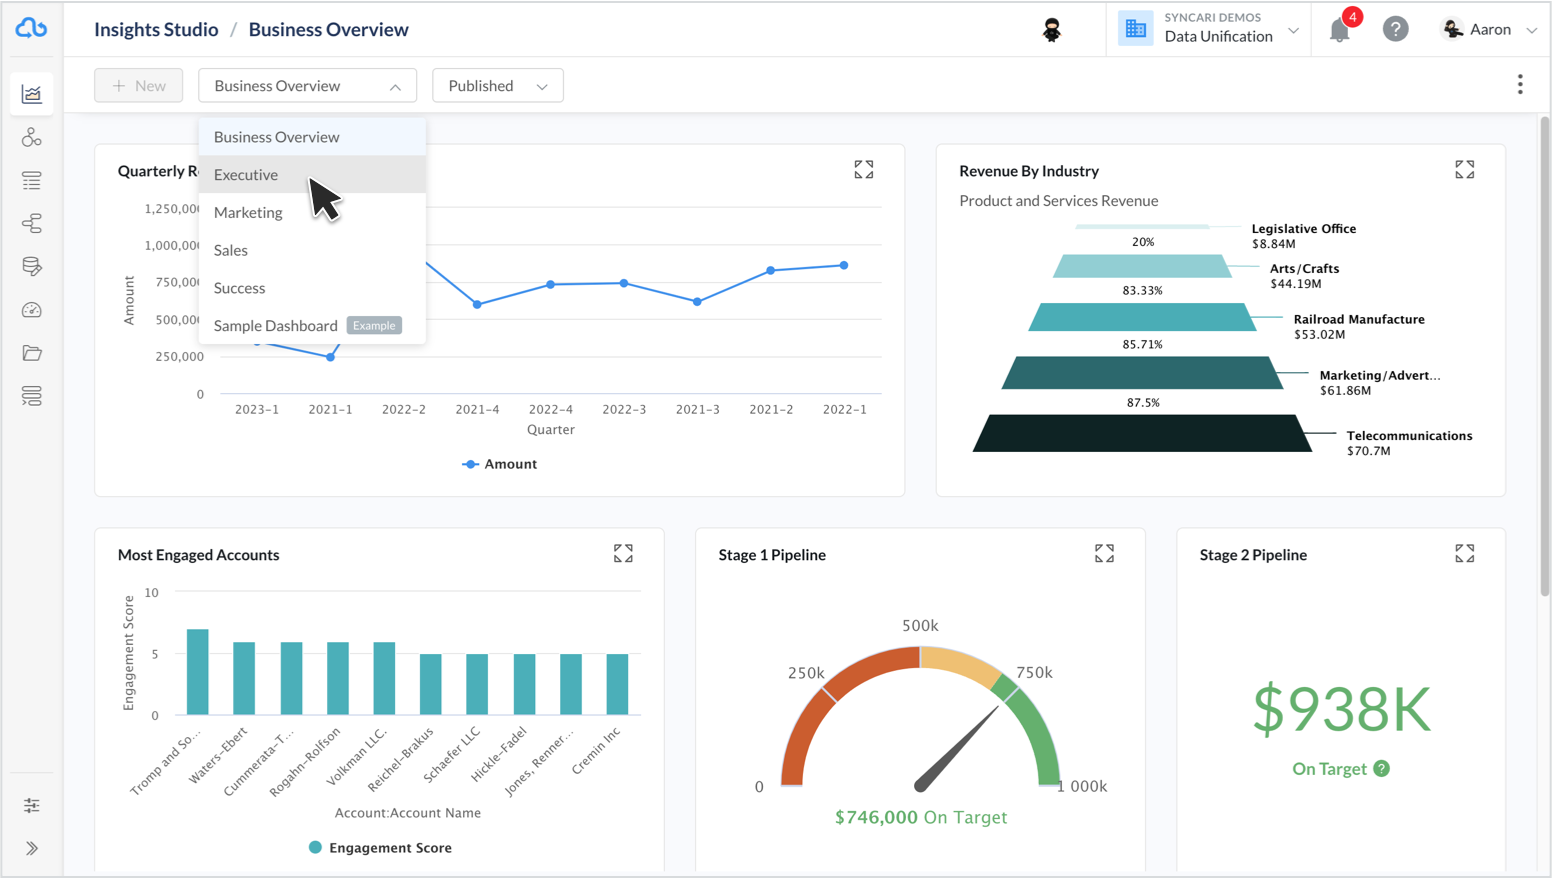
Improve visibility and alignment with sharable dashboards tailored to specific functions or objectives. Create custom roles to ensure the right people have access to the data they need to drive growth and optimize performance.
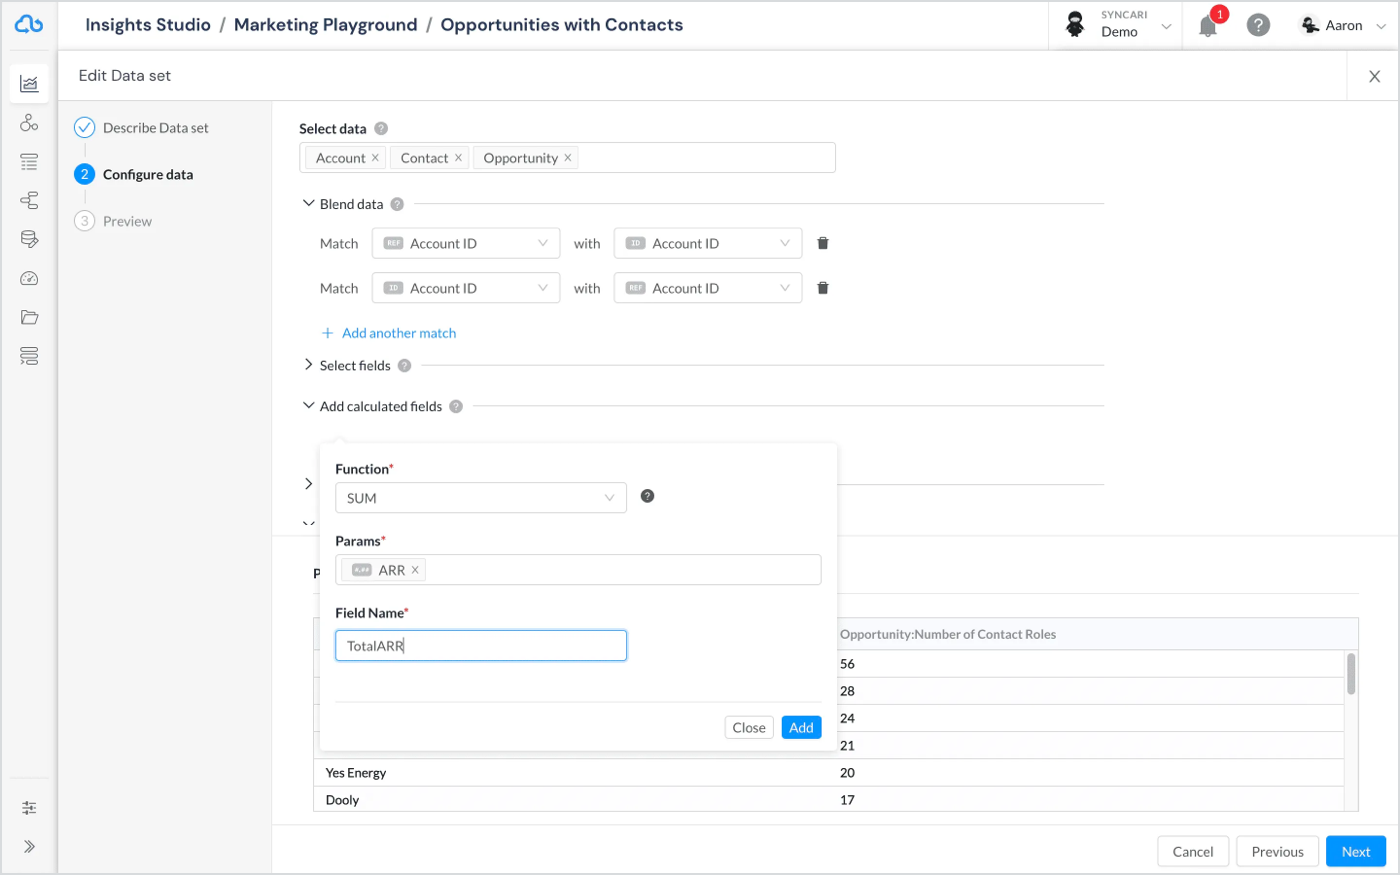
No. Syncari Insights is fully drag-and-drop, with an array of powerful features for building datasets using Syncari’s elastic data model, within a shared metric library. (View detailed terminology and documentation for Syncari Insights, and learn more about B2B customer data models here.).
While there are plenty of reasons SQL flexibility is advantageous, Syncari is convinced that reporting and dashboarding fundamentals should not be gated by overly custom data stacks and warehouse free-for-alls.
Don’t let SQL skills be the barrier between your revenue teams and your business strategy.
Yes. Thanks to Syncari’s unified data, you can build datasets from multiple systems. For example, if you want to look at counts of certain types of contacts from Salesforce and HubSpot and Zendesk and your user data warehouse, you can combine these into a single view within Syncari Insights.
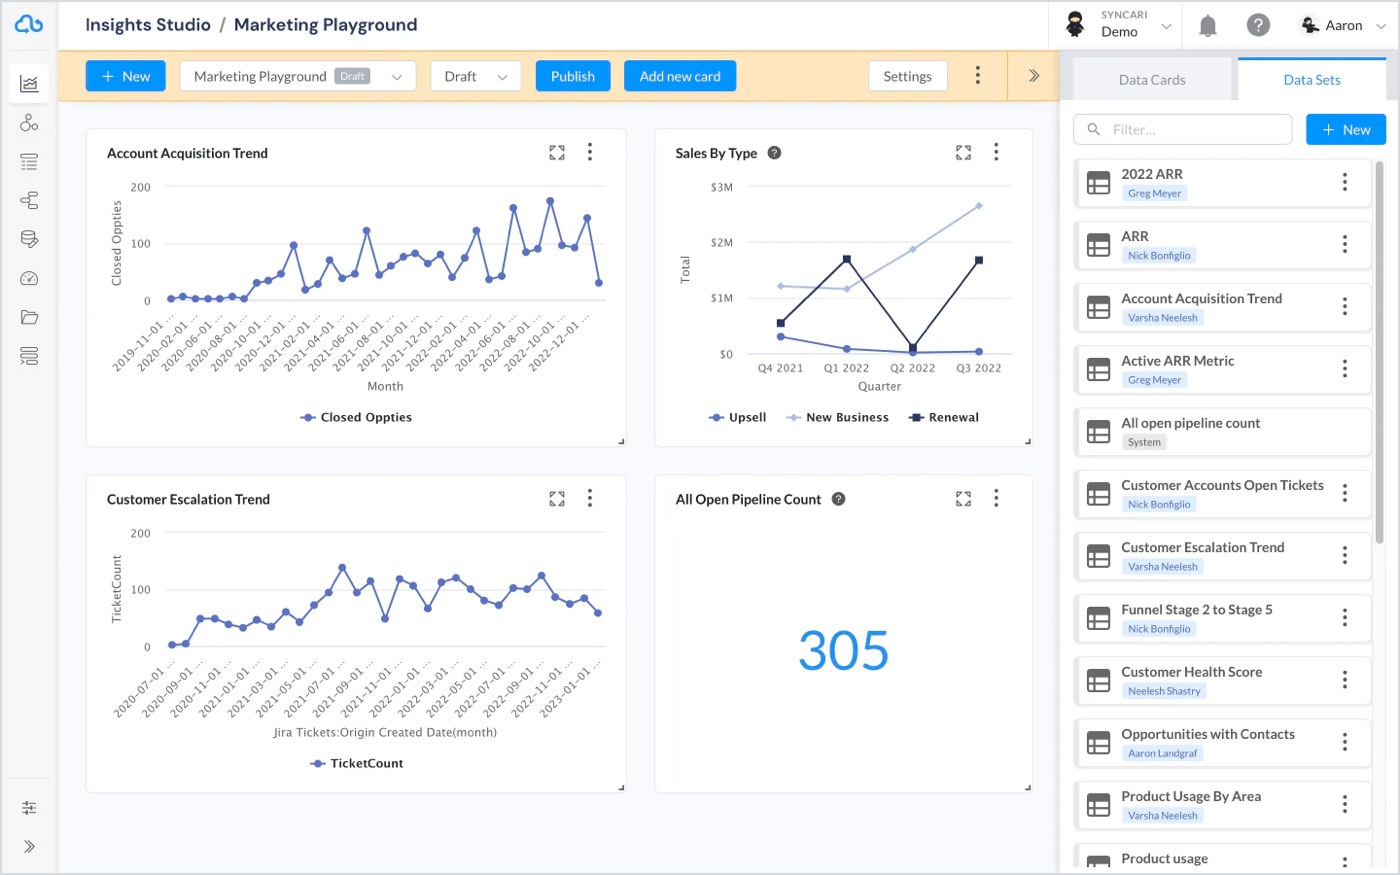
Traditionally, dashboards have had no way to report on the entire customer journey because it lives in multiple systems. Even shoving all that data into a CRM doesn’t work, because those CRM dashboards cannot unify multiple objects into a single dataset when desired.
The only way to pull off cross-system, cross-object reporting has been to pull the data from CRM, marketing automation, CS, product usage and finance tools into a warehouse, unify it there, then push it to a BI tool. While the tools may initially be inexpensive, they quickly add up as the business scales, and the complexity is undeniable. It’s difficult to keep these dashboards accurate and up-to-date. Then the inevitable question of “what’s the ROI of a dashboard?” comes up, because leadership sees the investment they’re making in this flow of data and the tools and teams that support it.
Unified reporting with Syncari Insights allows you to visualize the already-unified data across your systems, so you can easily build executive and team-specific dashboards in minutes.
It depends. If your objective with your BI tool (and the warehouse and pipelines underneath) has been to get a view of what’s really going on in your business so you can make better decisions, then yes: Syncari Insights can reflect an accurate bottoms-up view of your business.
If you have other analytical needs, like complex predictions, machine learning models, or your data stack has applications outside of Go-To-Market efficiency, then no, Syncari Insights is not going to replace your BI tool. Nevertheless, it can probably provide more accurate insights into the health of your business so that you can retire some difficult-to-maintain dashboards.
No. Syncari Insights relies on data from your GTM stack that has been unified inside of Syncari, and does not require an additional data warehouse.
Visit the documentation to understand how to use Syncari Insights.
Absolutely. Syncari integrates with S3, Redshift, Snowflake, BigQuery, PostgreSQL and many other data destinations. View the full list here.